
Grafana is one of the most popular open-source dashboarding and observability platforms. It’s brilliant at visualising data — but connecting it to a business system and building a dashboard from scratch usually means wiring up a data source, writing queries and laying out every panel by hand.
With the AI vibe-coding agent, you just describe what you want in plain English. The agent connects Grafana to your data, builds the dashboard and checks that every panel returns live data.
Watch the demo
The video is sped up while the agent works, but nothing else is edited.
The prompt
Connect this Grafana to my Odoo instance and build a sales dashboard with total revenue, number of orders, revenue over time by month, revenue by product and top customers.
What the agent did
- Connected to the Odoo instance over its API and pulled the confirmed sales orders.
- Installed the Infinity data source in Grafana and wired it directly to Odoo’s JSON-RPC endpoint.
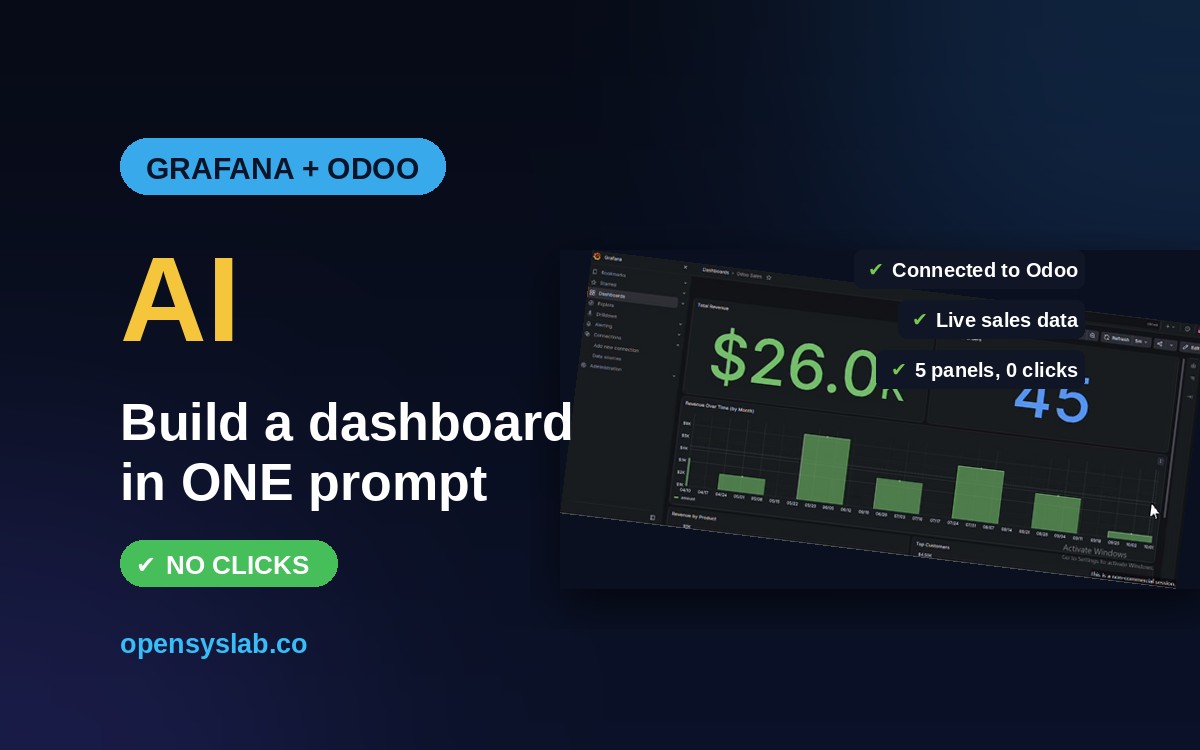
- Built a five-panel “Odoo Sales” dashboard — total revenue, number of orders, monthly revenue trend, revenue by product and top customers.
- Verified every panel returns live data, so the numbers update as new orders come in.
The result
A live Grafana dashboard reading straight from Odoo — $25,955.50 in revenue across 45 orders, a clean month-by-month trend, and breakdowns by product and customer. No manual panel building, no hand-written queries.
What else you can ask
- Connect Grafana to Postgres, MySQL, Prometheus, an API or your own app
- Build dashboards and panels from a plain-English brief
- Set up alert rules and notification policies
Get your own Grafana with the AI agent
Get a ready-to-use Grafana server with the AI vibe-coding agent built in. Choose your server size, and it is set up for you.